Environmental Variability
Temperature changes
|
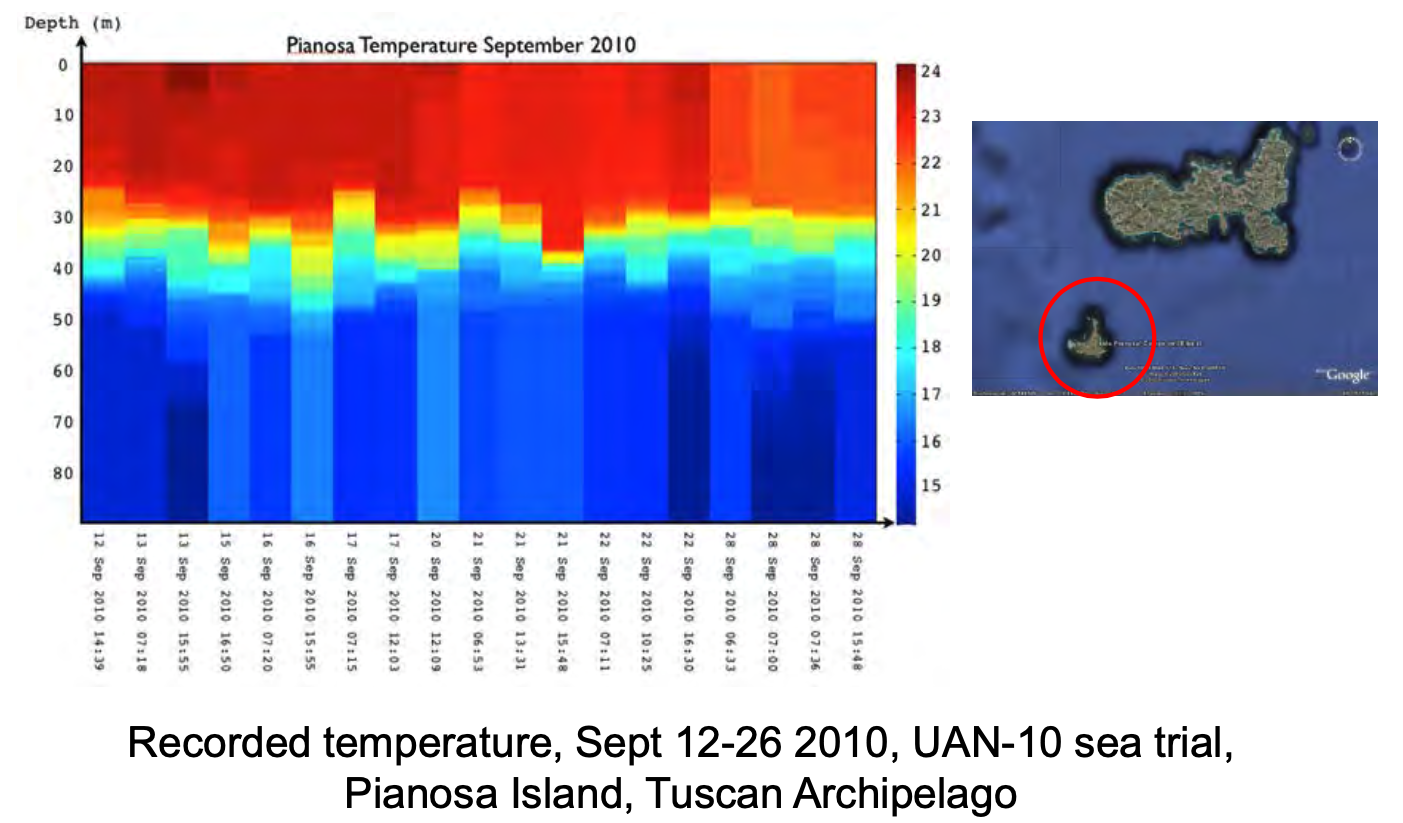
Note the variation in temperature across the hours of the day, and across days.
Gradient of temperature between 30m and 50m.
Sept. 21: three measurements
- note how warming of surface temperature increases temperature of water with the thermocline that moves deeper and becomes steeper
- note the presence of a surface duct in the first measurement at 06:53h. Warmer water is at 2m depth: in the morning the water is warmer at 2m depth.
Sept. 22: similar behaviour to that of Sept 21 but at 10:25h thermocline is higher.
Note that different environments means different acoustic performance!
From Sept 22 to Sept 28 bad weather and water mixing (not completely) which meant cooler water in the first part of the water column and less steep gradients.
Time-varying thermocline
Tranmission Loss - Source depth constant, SSP change

|
Figure from John Potter, ACommsNet13.
Source depth variation
Tranmission Loss - source depth change, SSP constant.

|
Figure from John Potter, ACommsNet13.
- Geometry and environmental variations are key to characterise acoustic propagation, even in the same geographical location!
What is the Extended Ellett Line?
The Extended Ellett Line is a project to measure and understand the ocean west of the UK. We are looking at how and why the currents, temperature and salinity have changed over the past few decades. We also investigate the impact those changes have on ecosystems and local climate.
Each year UK marine scientists cross the deep ocean between Scotland and Iceland on a research ship. Along the way the scientists measure the velocity, temperature and salinity of the ocean; at points 30 km apart, the ship stops and instruments are lowered though the water all the way to the seafloor. Water samples are also collected and analysed for a range of chemicals (including iron, nutrients and carbon) and biological content (including phytoplankton). The project is one of a small number of high-quality, long-term marine data sets in the North Atlantic Ocean and helps us to understand changes in ocean climate. It is relevant to the UK and northwest Europe because the warm water flowing past the Extended Ellett Line keeps winters warmer than expected for this latitude.
The history of the Extended Ellett Line began in 1948, when Jack R. Lumby of the Fisheries Laboratory in Lowestoft, UK, realised that use could be made of the regular passage of ships to the Ocean Weather Stations of the North Atlantic. These ships of opportunity collected underway measurements of sea surface temperature and salinity until 1996. From 1975 to 1996, scientists concentrated on the Rockall Trough, measuring the warm salty subtropical water flowing northwards west of the UK and Ireland. Since 1996 the annual expeditions travel as far Iceland in order to measure all the warm water that flows into the Nordics Seas from the eastern North Atlantic. We also measure cold northern water flowing southwards at the bottom of the sea.
From https://projects.noc.ac.uk/ExtendedEllettLine/project-information